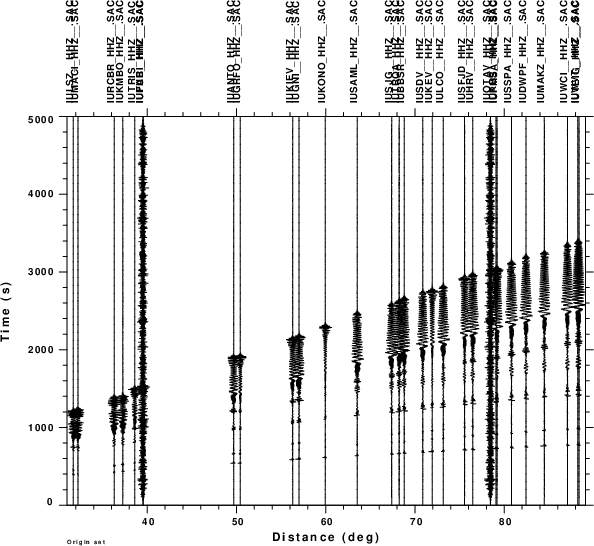
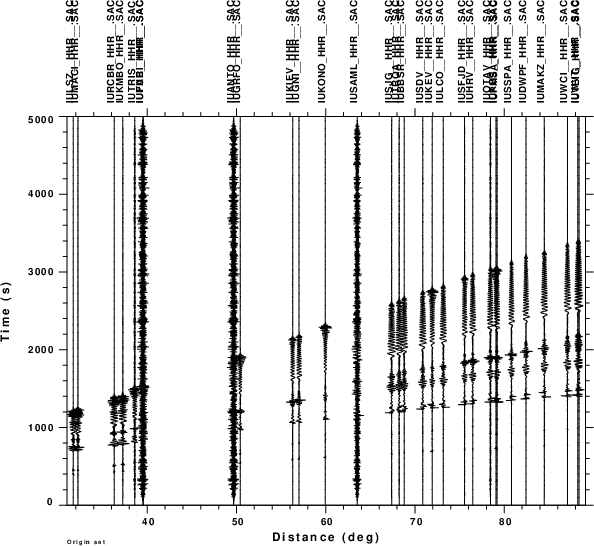
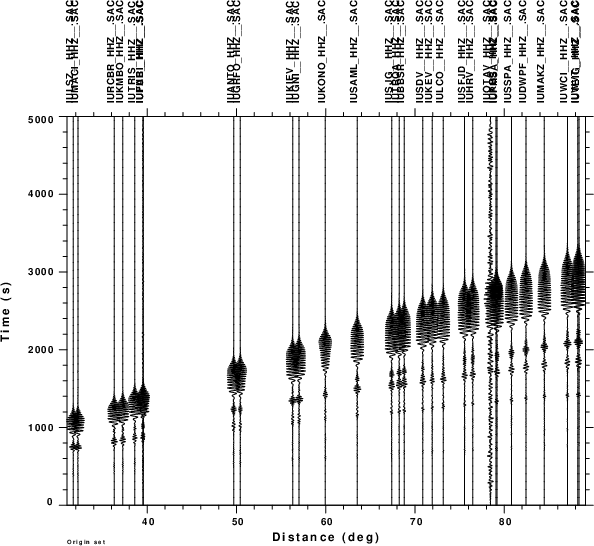
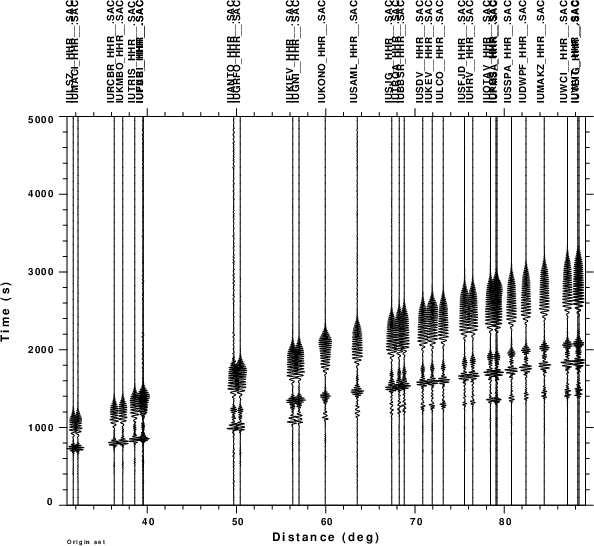
The first set of figures display the velocity traces for the mechanism described in Section 2. Each trace is plotted with the same amplitude in the figure. In the test of the detection procedure, only the vertical, Z, component traces are used. The second set of figures results from the application of a zero-phase bandpass filter implemented using the gsac command
transfer from none to none freqlimits 0.01 0.02 0.04 0.05
The sample rate of the 1s, which means that the Nuquist frequency is 0.5HZ. For this magnitude, the signal generally exceeds the ground noise.
| Z | R | T |
|---|---|---|
|
|
|
| Filtered Z | Filtered R | Filtered T |
|
|
|
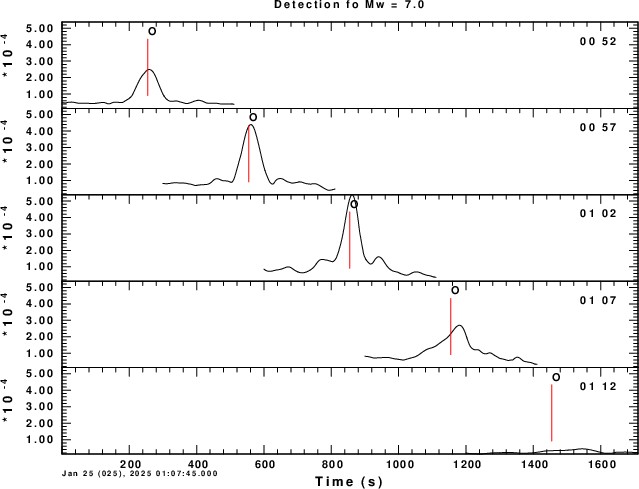
The detection script was run just using the true source position (0,0), but at different possibl e origin times, e.g., 00h52m, 00h57m, 01h02m (which is nearest to the true origina time), 01h07m and 01h12m. The next figure plots the stack in an absolute amplitude scale, th at shows that the envelope stack is a maximum near the tru origin time.
 |