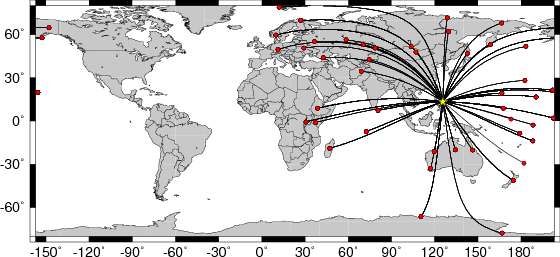
Location of the earthquake (yellow star) and great circle path from the epicenter to each station (red) [created using GMT (Wessel, P., and W. H. F. Smith, New version of Generic Mapping Tools released, EOS Trans. AGU, 76 329, 1995.)]
2008/03/03 14:11:16 13.40 125.70 24
For reference here are other moment tensor solutions for this event.
USGS Body-Wave Moment Tensor Solution

 08/03/03 14:11:12.15
 PHILIPPINE ISLANDS REGION
 Epicenter:  13.285  125.578
 MW 6.8

 USGS MOMENT TENSOR SOLUTION
 Depth  37         No. of sta: 52
 Moment Tensor;   Scale 10**19 Nm
   Mrr=-1.28       Mtt= 0.92
   Mpp= 0.36       Mrt=-0.26
   Mrp= 0.26       Mtp=-1.37
  Principal axes:
   T  Val=  2.08  Plg= 6  Azm=219
   N       -0.76       3      309
   P       -1.32      82       71

 Best Double Couple:Mo=1.8*10**19
  NP1:Strike=133 Dip=51 Slip= -85
  NP2:       305     39       -96

               #######
          #################
        #####################
      ##---------##############
    ##----------------###########
   ###-------------------#########
   ####--------------------#######
  #####---------------------#######
  ######----------   ---------#####
  #######--------- P ----------####
  ########--------   -----------###
  ##########--------------------###
   ###########------------------##
   #############-----------------#
    ###############-------------#
      #   ##############-------
        T ###################
          #################
               #######
|
USGS Centroid Moment Tensor Solution

 08/03/03 14:11:12.15
 PHILIPPINE ISLANDS REGION
 Epicenter:  13.285  125.578
 MW 6.9

 USGS CENTROID MOMENT TENSOR
 08/03/03 14:11:33.09
 Centroid:   13.568  126.013
 Depth  25         No. of sta:107
 Moment Tensor;   Scale 10**19 Nm
   Mrr=-2.28       Mtt= 1.64
   Mpp= 0.64       Mrt=-0.25
   Mrp=-0.49       Mtp=-1.60
  Principal axes:
   T  Val=  2.82  Plg= 1  Azm= 36
   N       -0.38      15      126
   P       -2.44      74      302

 Best Double Couple:Mo=2.6*10**19
  NP1:Strike=111 Dip=46 Slip=-111
  NP2:       322     48       -68

               #######
          #################
        ----############### T
      -----------##########   #
    ----------------#############
   -------------------############
   ---------------------##########
  #-----------   ---------#########
  ##---------- P ----------########
  ###---------   -----------#######
  #####---------------------#######
  #######--------------------######
   ########------------------#####
   ############---------------##--
    ###################--#####---
      #######################--
        #####################
          #################
               #######
|
Magnitude 6.9 PHILIPPINE ISLANDS REGION
Monday, March 03, 2008 at 14:11:14 UTC

Global CMT Project Moment Tensor Solution

March 3, 2008, PHILIPPINE ISLANDS REGION, MW=6.8

Liz Starin

CENTROID-MOMENT-TENSOR  SOLUTION
GCMT EVENT:     C200803031411A
DATA: II IU CU IC G  GE
L.P.BODY WAVES: 93S, 226C, T= 50
MANTLE WAVES:   93S, 196C, T=125
SURFACE WAVES:  92S, 207C, T= 50
TIMESTAMP:      Q-20080303151849
CENTROID LOCATION:
ORIGIN TIME:      14:11:21.6 0.1
LAT:13.54N 0.00;LON:125.63E 0.00
DEP: 18.0  0.2;TRIANG HDUR:  6.5
MOMENT TENSOR: SCALE 10**26 D-CM
RR=-1.850 0.012; TT= 1.460 0.009
PP= 0.387 0.010; RT= 0.126 0.029
RP= 0.524 0.032; TP=-1.610 0.008
PRINCIPAL AXES:
1.(T) VAL=  2.630;PLG= 3;AZM=216
2.(N)      -0.580;    21;    307
3.(P)      -2.053;    69;    119
BEST DBLE.COUPLE:M0= 2.34*10**26
NP1: STRIKE=285;DIP=46;SLIP=-120
NP2: STRIKE=145;DIP=51;SLIP= -62

            ###########
        ###################
      --#####################
    ---########################
   ----#------------############
  --###------------------########
  #####--------------------######
 #######---------------------#####
 #######-----------------------###
 ########-----------   ---------##
 #########---------- P ----------#
  #########---------   ----------
  ###########--------------------
   ###########------------------
    #############--------------
         ###########---------
       T ##################
            ###########
|
The following broadband stations passed the QC and were used for the source inversion. AAK ABPO ADK AFI ARU BILL BRVK CASY COLA CTAO DGAR FUNA FURI GRFO JOHN KBL KBS KDAK KEV KIEV KIP KIV KMBO KNTN KONO KURK KWAJ MBAR MBWA MIDW NWAO OBN PALK PET POHA RAO SBA SNZO TARA TIXI TLY ULN WAKE WRAB XMAS YAK YSS
All observed and Greens function waveforms are corrected to instrument response to ground velocity in meters/sec for the passband of 0.004 - 5 Hz. The traces were then lowpass filtered at 0.25 Hz and interpolated to a sample rate of 1 second.
The moment tensor solution used has the parameters:
HS=37
STK=133
DIP=51
RAKE=-85
MW=6.8

The Green's function closest to the desired depth was
DEP=0370 , where (DEP/10) is the computed depth.
The cut windows attempt to include the P, pP, sP, pS, S and sS arrivals. However, one must be very careful about the fact that PP may be included in some distance ranges.
The waveforms are then bandpass filtered by the application of the following high- and low-pass stages (an optional microseism filter):
hp c 0.0083 2
lp c 0.0250 2
int
br c 0.12 0.25 n 4 p 2
The traces were next integrated to ground displacement in meters. Finally the observed data are interpolated to have the same sampling at the Green's functions.
The following filter ranges are used according to the moment magnitude Mw:
   FILTER_BAND   1/FH(s)  1/FL(s)
       1           60     12      Mw < 6.4
       2          100     20      6.4 < Mw <= 6.9
       3          120     40      Mw > 6.9
The map displays the distribution of stations used for this source inversion.
|
Location of the earthquake (yellow star) and great circle path from the epicenter to each station (red) [created using GMT (Wessel, P., and W. H. F. Smith, New version of Generic Mapping Tools released, EOS Trans. AGU, 76 329, 1995.)] |
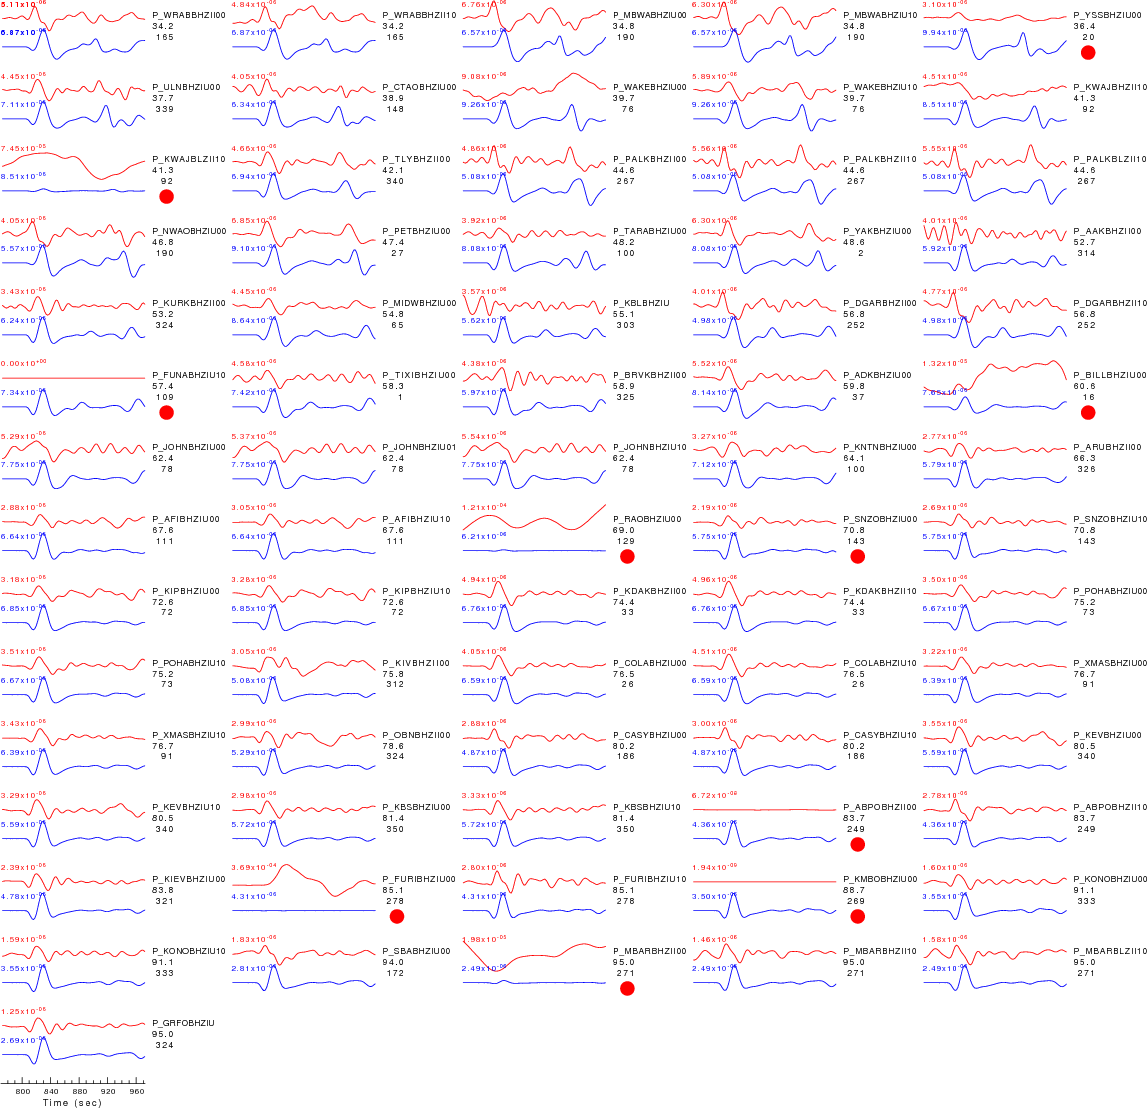
| P-wave Z component |
|
| Observed (red) and predicted seismograms (blue) ordered by increasing epicentral distance. Each pair of traces is annotated with the wave type and a station identifier (station, network, and channel id's), epicentral distance in degrees, source-to-station azimuth in degrees. Each seismogram pair is plotted with the same scale and the peak amplitudes in meters are shown above to the left of each trace. The optimal time shift between the observed first arrival and the predicted first arrival (in seconds) is shown above the prediction on the right. Red circles flag seismograms with amplitude misfits of a factor of 2 or more. |
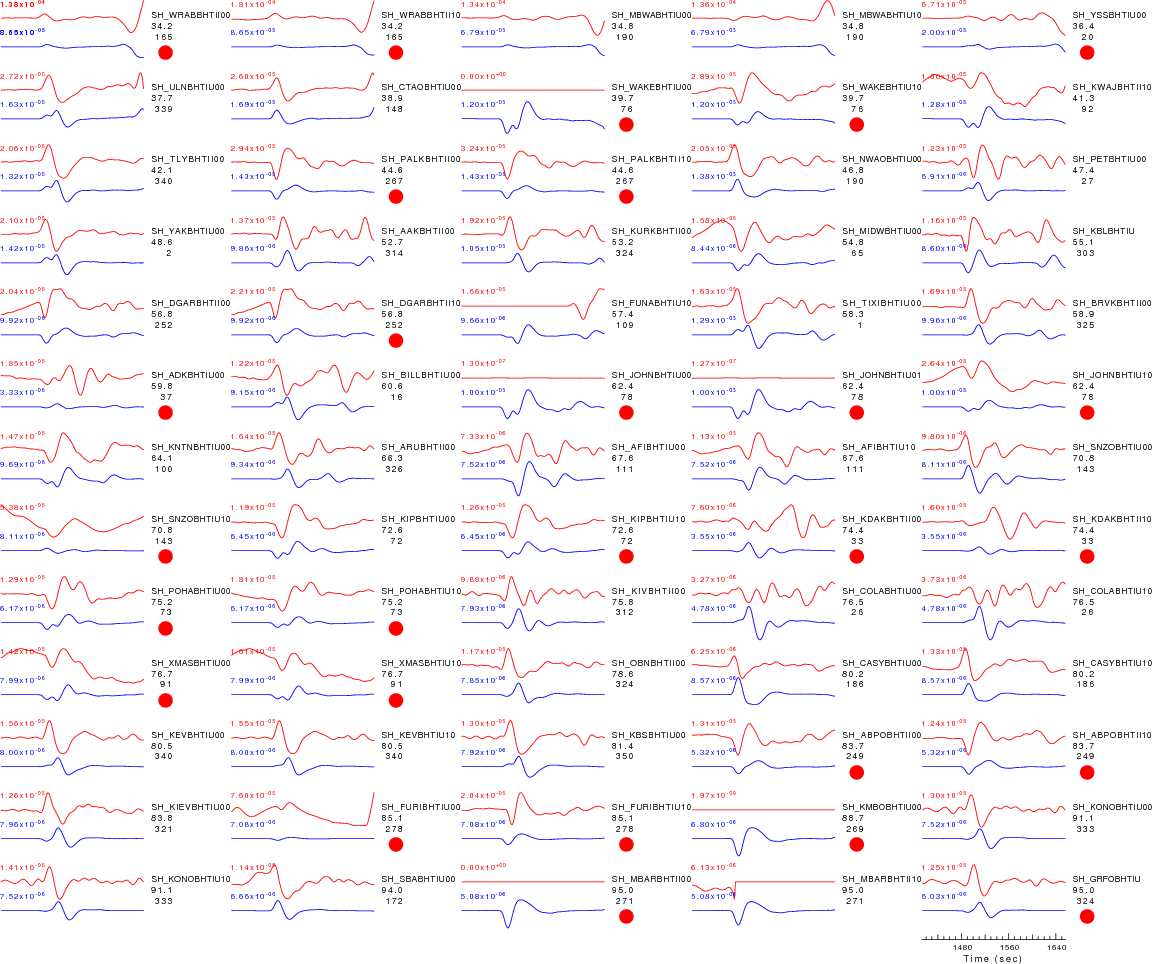
| SH-wave T component |
|
| Observed (red) and predicted seismograms (blue) ordered by increasing epicentral distance. Each pair of traces is annotated with the wave type and a station identifier (station, network, and channel id's), epicentral distance in degrees, source-to-station azimuth in degrees. Each seismogram pair is plotted with the same scale and the peak amplitudes in meters are shown above to the left of each trace. The optimal time shift between the observed first arrival and the predicted first arrival (in seconds) is shown above the prediction on the right. Red circles flag seismograms with amplitude misfits of a factor of 2 or more. |
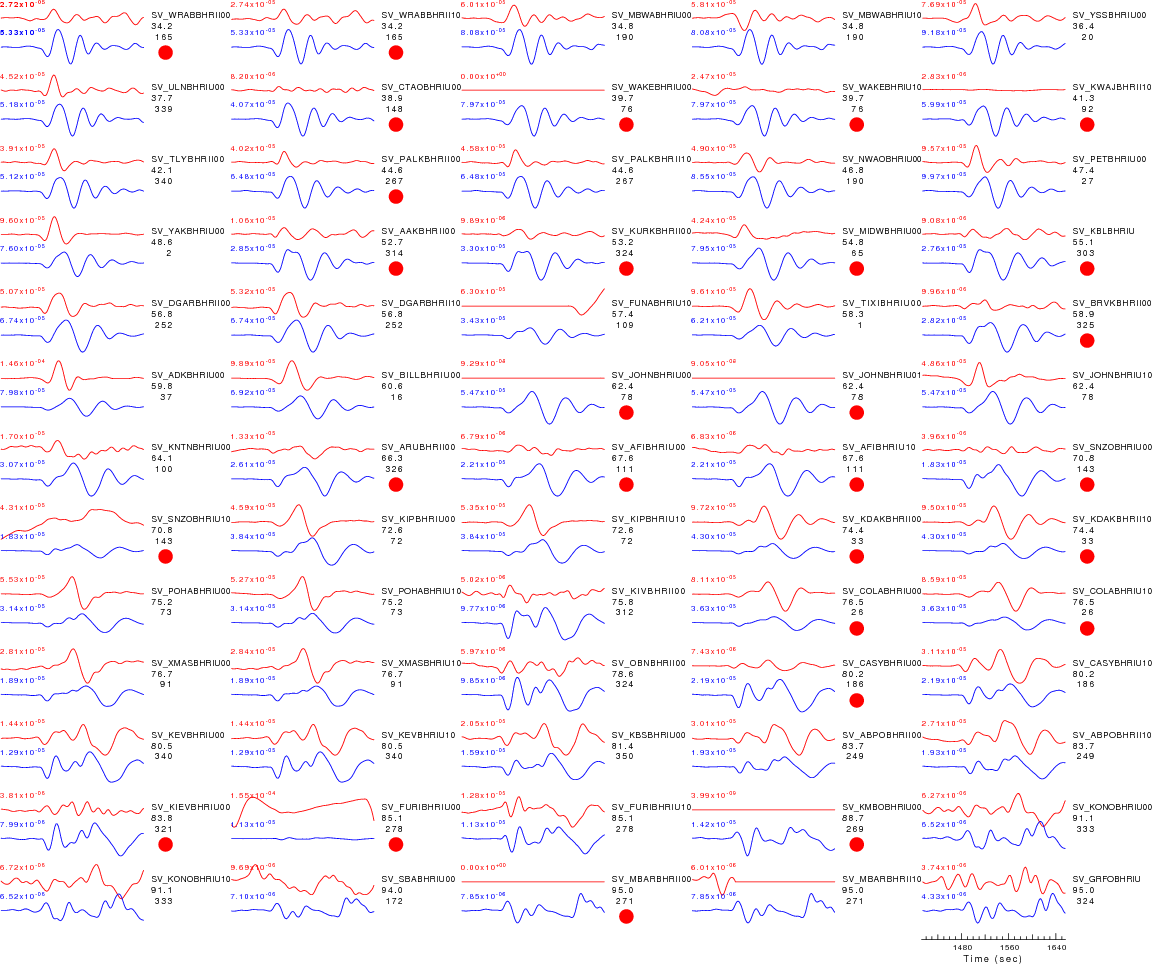
| SV-wave R component |
|
| Observed (red) and predicted seismograms (blue) ordered by increasing epicentral distance. Each pair of traces is annotated with the wave type and a station identifier (station, network, and channel id's), epicentral distance in degrees, source-to-station azimuth in degrees. Each seismogram pair is plotted with the same scale and the peak amplitudes in meters are shown above to the left of each trace. The optimal time shift between the observed first arrival and the predicted first arrival (in seconds) is shown above the prediction on the right. Red circles flag seismograms with amplitude misfits of a factor of 2 or more. |
AAKII00BHR AAKII00BHT AAKII00BHZ ABPOII00BHR ABPOII00BHT ABPOII00BHZ ABPOII10BHR ABPOII10BHT ABPOII10BHZ ADKIU00BHR ADKIU00BHT ADKIU00BHZ AFIIU00BHR AFIIU00BHT AFIIU00BHZ AFIIU10BHR AFIIU10BHT AFIIU10BHZ ARUII00BHR ARUII00BHT ARUII00BHZ BILLIU00BHR BILLIU00BHT BILLIU00BHZ BRVKII00BHR BRVKII00BHT BRVKII00BHZ CASYIU00BHR CASYIU00BHT CASYIU00BHZ CASYIU10BHR CASYIU10BHT CASYIU10BHZ COLAIU00BHR COLAIU00BHT COLAIU00BHZ COLAIU10BHR COLAIU10BHT COLAIU10BHZ CTAOIU00BHR CTAOIU00BHT CTAOIU00BHZ DGARII00BHR DGARII00BHT DGARII00BHZ DGARII10BHR DGARII10BHT DGARII10BHZ FUNAIU10BHR FUNAIU10BHT FUNAIU10BHZ FURIIU00BHR FURIIU00BHT FURIIU00BHZ FURIIU10BHR FURIIU10BHT FURIIU10BHZ GRFOIUBHR GRFOIUBHT GRFOIUBHZ JOHNIU00BHR JOHNIU00BHT JOHNIU00BHZ JOHNIU01BHR JOHNIU01BHT JOHNIU01BHZ JOHNIU10BHR JOHNIU10BHT JOHNIU10BHZ KBLIUBHR KBLIUBHT KBLIUBHZ KBSIU00BHR KBSIU00BHT KBSIU00BHZ KBSIU10BHZ KDAKII00BHR KDAKII00BHT KDAKII00BHZ KDAKII10BHR KDAKII10BHT KDAKII10BHZ KEVIU00BHR KEVIU00BHT KEVIU00BHZ KEVIU10BHR KEVIU10BHT KEVIU10BHZ KIEVIU00BHR KIEVIU00BHT KIEVIU00BHZ KIPIU00BHR KIPIU00BHT KIPIU00BHZ KIPIU10BHR KIPIU10BHT KIPIU10BHZ KIVII00BHR KIVII00BHT KIVII00BHZ KMBOIU00BHR KMBOIU00BHT KMBOIU00BHZ KNTNIU00BHR KNTNIU00BHT KNTNIU00BHZ KONOIU00BHR KONOIU00BHT KONOIU00BHZ KONOIU10BHR KONOIU10BHT KONOIU10BHZ KURKII00BHR KURKII00BHT KURKII00BHZ KWAJII10BHR KWAJII10BHT KWAJII10BHZ KWAJII10BLZ MBARII00BHR MBARII00BHT MBARII00BHZ MBARII10BHR MBARII10BHT MBARII10BHZ MBARII10BLZ MBWAIU00BHR MBWAIU00BHT MBWAIU00BHZ MBWAIU10BHR MBWAIU10BHT MBWAIU10BHZ MIDWIU00BHR MIDWIU00BHT MIDWIU00BHZ NWAOIU00BHR NWAOIU00BHT NWAOIU00BHZ OBNII00BHR OBNII00BHT OBNII00BHZ PALKII00BHR PALKII00BHT PALKII00BHZ PALKII10BHR PALKII10BHT PALKII10BHZ PALKII10BLZ PETIU00BHR PETIU00BHT PETIU00BHZ POHAIU00BHR POHAIU00BHT POHAIU00BHZ POHAIU10BHR POHAIU10BHT POHAIU10BHZ RAOIU00BHZ SBAIU00BHR SBAIU00BHT SBAIU00BHZ SNZOIU00BHR SNZOIU00BHT SNZOIU00BHZ SNZOIU10BHR SNZOIU10BHT SNZOIU10BHZ TARAIU00BHZ TIXIIU00BHR TIXIIU00BHT TIXIIU00BHZ TLYII00BHR TLYII00BHT TLYII00BHZ ULNIU00BHR ULNIU00BHT ULNIU00BHZ WAKEIU00BHR WAKEIU00BHT WAKEIU00BHZ WAKEIU10BHR WAKEIU10BHT WAKEIU10BHZ WRABII00BHR WRABII00BHT WRABII00BHZ WRABII10BHR WRABII10BHT WRABII10BHZ XMASIU00BHR XMASIU00BHT XMASIU00BHZ XMASIU10BHR XMASIU10BHT XMASIU10BHZ YAKIU00BHR YAKIU00BHT YAKIU00BHZ YSSIU00BHR YSSIU00BHT YSSIU00BHZ
Starting Processing         : Wed Mar 12 17:01:14 UTC 2008
Starting wget to get files  : Wed Mar 12 17:01:38 UTC 2008
Unpacking SEED volume       : Wed Mar 12 17:01:38 UTC 2008
Starting deconvolution      : Wed Mar 12 17:01:42 UTC 2008
Starting trace rotation     : Wed Mar 12 17:02:36 UTC 2008
Starting distance selection : Wed Mar 12 17:02:48 UTC 2008
Starting trace QC           : Wed Mar 12 17:02:53 UTC 2008
Starting synthetic          : Wed Mar 12 17:02:53 UTC 2008
Starting documentation      : Wed Mar 12 17:03:52 UTC 2008
Processing Completion       : Wed Mar 12 17:03:53 UTC 2008